Explore unique commuting patterns in New York and New Jersey with our slider map tool. This dynamic visualization showcases the contrasts between public transit users and car drivers traveling into Manhattan’s Central Business District (CBD) for work.
Instructions
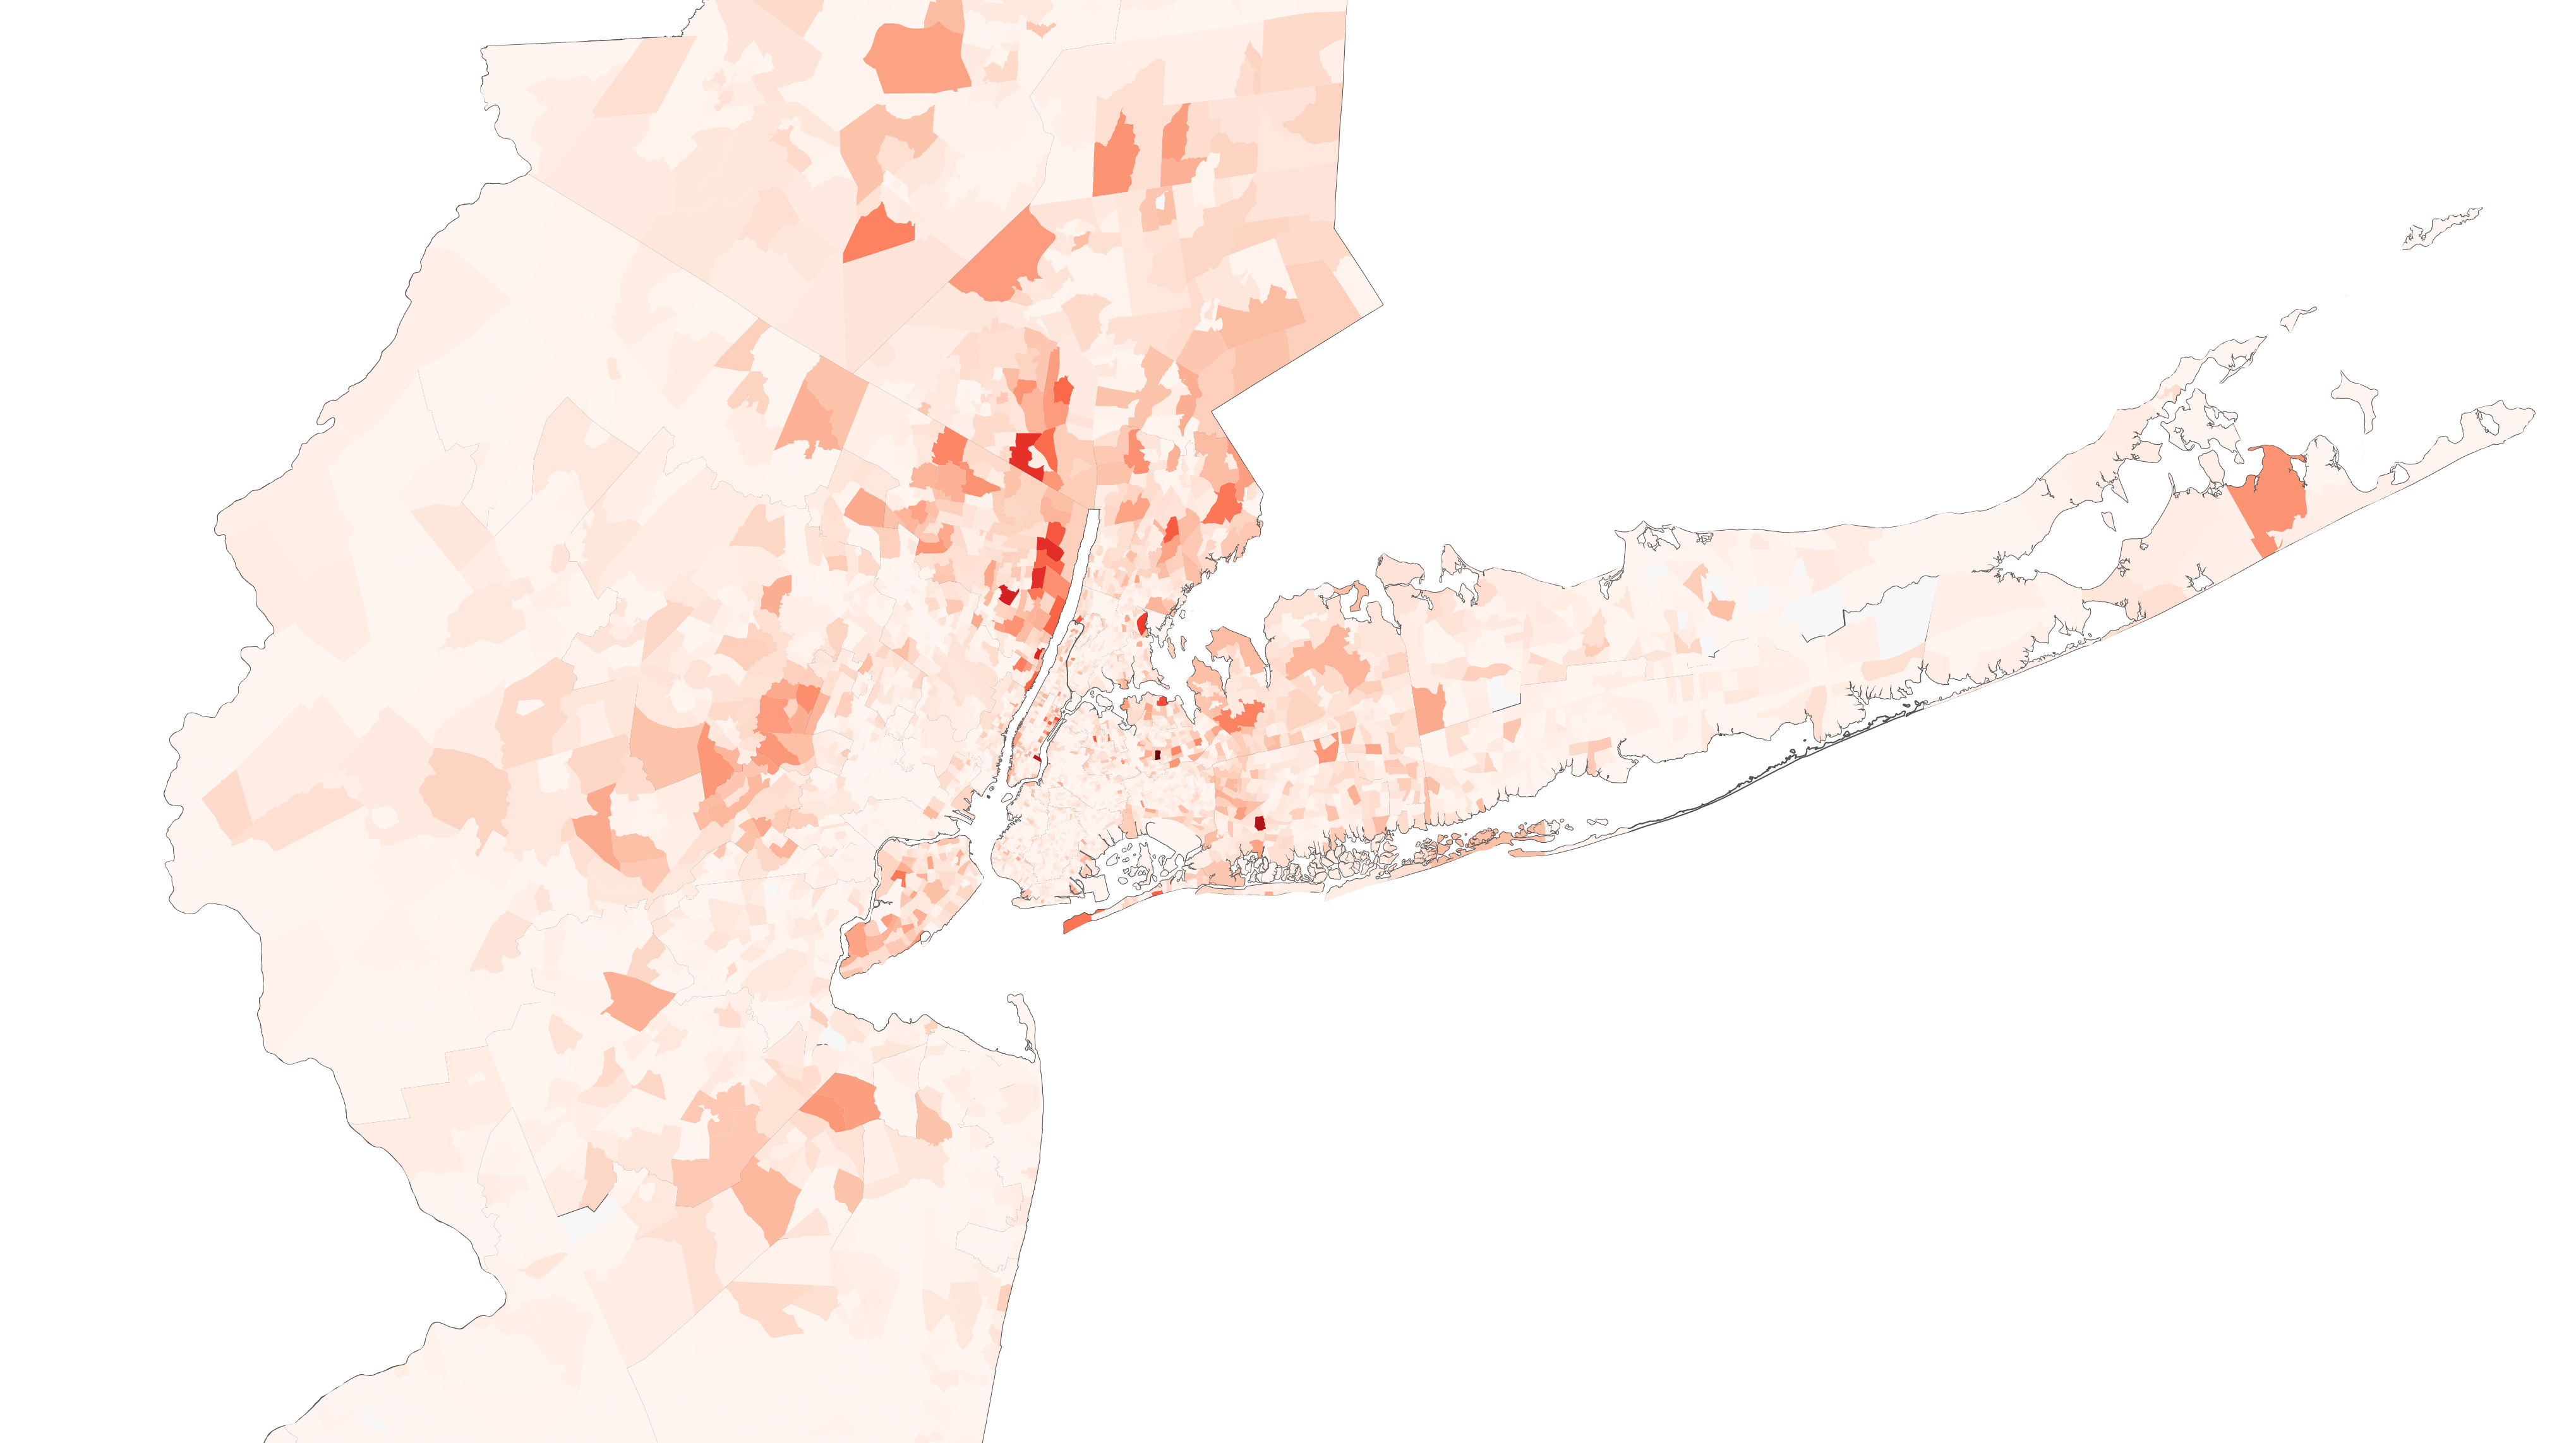
Download Transit Rider Density Map (Export PNG)
Download Driver Density Map (Export PNG)
Explore the commuting dynamics within each legislative and congressional district with our interactive chart. Each bar shows the percentage distribution of Manhattan CBD-bound commuters, highlighting the proportion of those who rely on public transit versus those who drive. Hover over or click on your specific district to view the exact percentage breakdown.
Have Questions or Feedback?